Why I Simplified My Homelab

Last year, I wrote about what was inside my homelab .
Since then, I went quite a bit further: a three-node Proxmox cluster, virtual machines and containers, Talos Kubernetes, Cilium, Argo CD, Longhorn, replicated storage, and workloads configured for failover.
I ran that setup for roughly a month. It was a useful learning experience, and I do not regret building it.
But I started noticing something about how I spent my time.
When I wanted to deploy an application, I was thinking about the infrastructure first. Where should it run? What storage should it use? How would its data move between nodes? Which controller or integration needed attention before the application could work?
Sometimes deploying one component meant becoming responsible for another four or five.
Eventually, I realised that what I wanted from the lab had changed. I still wanted to learn, but I also wanted to build things and use the services I hosted.
The biggest improvement was not adding another tool. It was making the setup simpler.
This is the story of what I tried, what I kept, and what I would choose differently now. The goal was never to build the most impressive lab. It was to learn enough to know what I actually need, and to spend less time maintaining the platform around the services.
What I Had Before#
The previous architecture had several layers:
Three physical machines
        |
        +-- Proxmox cluster
                |
                +-- VMs and Linux containers
                |
                +-- Talos Kubernetes
                        +-- Cilium networking
                        +-- Argo CD deployments
                        +-- Longhorn storage
Some infrastructure services used Proxmox HA with replicated disks. Kubernetes workloads had their own scheduling, networking, and storage behaviour.
These were real systems, not just boxes in a diagram. My runbooks include controlled relocations, replication checks, and a Longhorn test where a workload recovered on another node with its test data intact.
But there were important distinctions underneath the word HA.
Proxmox HA could restart an eligible guest on another host. Disk replication had its own interval and recovery implications. Kubernetes could reschedule a pod, but its volume still needed to become available. Longhorn replicas did not replace backups.
Each layer solved a problem. Each also introduced something else to understand, monitor, upgrade, and recover.
For a lab focused on learning those systems, that is part of the point. For a lab I also depended on and wanted to deploy applications into, it became friction.
What Three Nodes Did Not Solve#
Homelab communities have some excellent cluster builds. There is nothing wrong with running Proxmox, Kubernetes, or distributed storage at home. I wanted to learn those systems, and I did.
But those systems need time. Not just time to install them—time to operate them.
Having three nodes was not the same as making the whole service highly available. A second node can help with a failed machine. It does not automatically solve:
- A power outage affecting every machine.
- A failed router or switch.
- An unavailable DNS resolver.
- An ISP outage.
- Corrupted application data.
- A broken upgrade replicated across the system.
- Insufficient capacity on the surviving nodes.
Those are different failure domains. For an internet-facing service, upstream connectivity matters. For local home automation, the internet may not matter at all—but power, the local network, and the controller still do.
I could keep expanding the design to address more of those failures. That would be a valid project. It is not the project I want my home infrastructure to become right now.
The current design is deliberately one node. The next improvements I care about are not another orchestrator. They are the things that address the failure domains above.
The Current Setup#
The lab now runs on a Dell OptiPlex mini PC, with an Intel Core i5-9400T and 32 GB of RAM.
Debian runs directly on the hardware. Most applications run in Docker, deployed as Portainer stacks.
A few components remain native because they need access to the host, its hardware, its network interfaces, or its filesystem: WireGuard, Samba, the Beszel monitoring agent, SMART monitoring, and my coding agents, OpenCode and Hermes. The shared Markdown preview service is also a native CLI process.
Relationships, not redundant paths. Private addresses are omitted.
The switch is managed, and its management interface is available through a private Caddy route.
A managed switch does not, by itself, mean the network is segmented. I do not want the diagram to imply VLAN isolation or redundant switching that the current deployment does not establish.
The useful part is being explicit about what exists—not making the architecture look larger than it is.
Storage: Ordinary Filesystems, Clear Responsibilities#
The current storage layout uses XFS for both the primary NVMe filesystem and the internal SATA application-data filesystem. The external backup disk uses ext4.
| Storage | Role |
|---|---|
| Primary NVMe (XFS) | Debian, Docker images, runtime state and Docker-managed volumes |
| Internal SATA SSD (XFS) | Persistent application bind data |
| External USB SSD (ext4) | Time Machine destination and selected homelab backups |
I am no longer putting application storage behind a distributed block-storage layer.
That does not mean XFS is universally better than ZFS, ext4, or Longhorn. It means this setup no longer needs storage replication between three nodes. A filesystem choice on its own is not a backup or redundancy strategy.
Application data follows a consistent convention:
/data/apps/<service>/

/data/apps/
├── homeassistant/
├── immich/
├── jellyfin/
├── homepage/
├── browser/
└── mdx/
Docker’s own storage remains on the NVMe. Persistent application bind data lives on the SATA disk.
That separation makes it easier to answer what belongs to an application and what can be recreated from an image.
Mounts are checked against filesystem UUIDs. A directory existing at /data is not proof that the correct disk is mounted there. Otherwise an application can start writing into the mountpoint on the root filesystem while the expected data disk is absent.
That is the sort of detail that matters more during recovery than the number of storage features in a dashboard.
Why ext4 on the External Disk?#
The backup disk is a separate 1.92 TB SSD, connected over USB and mounted at /BACKUP.
It remains a Linux filesystem. My Mac does not need to mount ext4 directly because it accesses the disk over SMB:
MacBook → SMB → Samba → ext4 filesystem
That distinction matters. Choosing ext4 does not make the disk directly readable by every operating system. Samba provides the network compatibility.
The USB connection also deserved testing. With the cable used during verification, the USB-C connection negotiated at USB 2.0 speed. The selected rear USB-A connection negotiated at 5 Gbps.
The connector shape was not enough to tell me which connection was faster.
Samba and MacBook Backups#
Samba runs natively and exposes two authenticated shares:
| Share | Purpose |
|---|---|
MEDIA | Shared media and downloads |
BACKUP | Time Machine and backup storage |
The media share and the media containers use the same underlying directories:
                     ┌── Samba MEDIA share
/data/apps/smb/ ──────┼── Jellyfin libraries
                     ├── Motrix downloads
                     └── qBittorrent downloads
There is no reason for these applications to copy files between separate “SMB storage” and “container storage” trees when they are on the same host. Consistent ownership keeps files created by one consumer usable by the others.
For the MacBook, Samba’s Apple extensions and Avahi advertise BACKUP as a Time Machine destination. Only that share is advertised for Time Machine; MEDIA stays media-only.
SMB is a private network service. Port 445 is not something I forward to the internet.
There are limits here too. Time Machine currently has no configured size cap, so capacity needs watching. And a MacBook backup on this disk is not evidence that every application on the server has a complete backup policy.
DNS: One Name, Different Paths#
The DNS setup is more deliberate than “point everything at the server.”
Internally, clients use AdGuard Home, which forwards recursive queries to Unbound.
Client → AdGuard Home → Unbound → DNS hierarchy
AdGuard handles filtering and local rewrites. Unbound performs recursive resolution and DNSSEC validation.
For reverse-proxied applications, internal rewrites direct the service names to Caddy’s private address. This means a service can keep the same HTTPS hostname while taking a different network path depending on where the client is.
The hostname is illustrative. The application URL stays the same; the network path changes.
Public records are managed in Cloudflare using DNS-only records. There is no public wildcard DNS record. Private HTTPS origins have explicit private-IP mappings where configured; approved public services have explicit public-IP records.
Internally, a wildcard rewrite is useful because new proxy-managed names can resolve without adding a separate local entry every time.
Those two policies are not contradictory. Internal DNS convenience does not require publishing a public wildcard.
DNS Is Not the Security Boundary#
A private IP appearing in public DNS does not make it reachable from the internet. Equally, hiding a hostname does not secure a service.
Publishing a service requires more than changing an A record:
- Its public name must resolve correctly.
- The network path must reach the server.
- Caddy must explicitly permit that public route.
- The application must enforce its intended access model.
A leftover public DNS record is not permission to bypass a private proxy policy.
Why There Is No Public DNS Fallback#
One lesson from the previous setup was that adding a public resolver as “secondary DNS” can break split DNS.
Clients do not universally treat resolver lists as a strict primary-then-backup sequence. A public resolver can return a different answer, and the client can keep using it.
That previously contributed to an SMB mount failure: a private service name resolved to the wrong destination.
The current host and container DNS defaults use the internal resolver. Real DNS redundancy would require another internal resolver with matching records—not an unrelated public fallback.
Caddy, HTTPS, and Access Control#
Caddy is the common web entry point.
For web traffic, Docker publishes 443/TCP and 443/UDP. It does not publish port 80 or each application’s management port. DNS is a separate approved publication; native services such as SSH, WireGuard, and Samba have their own listeners and access requirements.
Certificates use DNS-based validation, so certificate issuance does not require exposing an HTTP challenge endpoint.
A wildcard certificate and wildcard DNS are separate things. I can use the former without publishing the latter.
Inside Docker, upstreams use service names rather than fixed container addresses:
HTTPS request → Caddy → application:port
Private routes apply source restrictions. Where appropriate, Tinyauth adds forward authentication using Pocket ID.
Applications that need native login, API access, mobile clients, or WebSockets retain the authentication flow suited to them.
OpenCode is one example: its remote HTTPS interface uses its own pairing and authentication rather than putting an incompatible interactive login gate in front of the native client.
The public Markdown workspace is a different, deliberate exception: it allows anonymous reading and editing. Only documents intended for public sharing go there. It is not where credentials or infrastructure configuration belong.
WireGuard provides remote access to the private network. The LAN, VPN peers, and Docker bridge use distinct subnets, which keeps their roles clearer when tracing traffic.
This is still not a claim that containers on one shared bridge are isolated from one another like separate security zones.
Why WireGuard Instead of Tailscale#
I used Tailscale for a while. It is built on WireGuard, but it is not just the protocol: it adds a coordination service, NAT traversal, identity, ACLs and a management layer. That is valuable when you have many devices, changing networks or other people using the lab.
I have a static public IP and a small, single-user setup. After a run of bugs and security advisories, I removed Tailscale and used WireGuard directly. The data path is still WireGuard; what I gave up is the coordination layer. I manage keys, peer profiles, routes and DNS myself. That is fewer moving parts and one less third-party dependency.
The trade-off is real: no automatic NAT traversal, no device SSO and no ACL UI. If I did not have a reachable address, or if I shared the lab with other people, Tailscale would be more compelling. This is my reason for the change, not a claim that Tailscale is insecure.
What Runs Here#
The applications are grouped by what I use them for, rather than by deployment technology.
| Purpose | Services |
|---|---|
| Photos, files, and documents | Immich, OpenCloud, Paperless |
| Notes and saved information | Nivra, Karakeep |
| Media | Jellyfin and download tools |
| Home automation | Home Assistant, Frigate, Mosquitto |
| Development and automation | Orva, n8n, private registry, object storage |
| Shared infrastructure | Caddy, AdGuard Home, Unbound, Pocket ID, Tinyauth |
| Visibility | Beszel, Homepage, hardware and diagnostic collectors |
| Agent infrastructure | OpenViking, Ollama, browser runtime, disposable test environments |
| Draft sharing | mdx, serving an editable Markdown workspace |
Not every restored stack is necessarily an active service. Historical configuration stays distinguishable from the current deployment.
That is particularly important in a repository containing both the old cluster and the new single-node setup.
Documentation: A Log, a Source of Truth, and Agent Memory#
Documentation is part of operating the system, not something I add after it is finished. I use a few layers, and they answer different questions.
- Git — the reproducible source: Compose files, runbooks, diagrams and verification scripts.
- Notion — the operations log: what changed, tests, incidents, decisions and open questions.
- Memory (OpenViking) — shared agent memory: context, prior work and retrieved knowledge.
- Skills — reusable procedures, shared or agent-specific.
- MCP — tools and structured access to other systems.
Git: The Reproducible Source#
The Homelab repository contains deployment definitions, sanitized configuration, verification scripts, diagrams and runbooks.
Homelab/
├── AGENTS.md
├── infrastructure/
│   ├── server/
│   │   ├── *.compose.yaml
│   │   ├── host/
│   │   └── wireguard/
│   ├── homeassistant/
│   ├── smb/
│   ├── browser/
│   ├── mdx/
│   └── agents/
└── docs/
    └── architecture/
        ├── inventory.json
        ├── diagram generators
        └── public-safe exports
Older cluster directories remain historical references. Their existence does not mean those workloads still run.
Secrets are not part of the reproducible configuration. Credentials belong in the password manager or protected runtime files, not committed .env files or copied command output.
Portainer is the application deployment interface. The repository records intended configuration and recovery procedures. A committed file does not prove the running service matches it; that still needs checking.
Notion: The Operations Log#
Notion is my log, not my source of truth. It records what changed, when, what was tested, what failed and what remains unverified. It is where I can reconstruct the story of a service without reading every commit.
That distinction matters. I do not try to keep Notion in perfect sync with every Compose file. The repository holds the reproducible definition; Notion holds the operational narrative and the evidence.
“Configured” and “verified” are different states, and I try to preserve that distinction.
OpenViking: Shared Memory for Agents#
If I had to pick the part that changed how the lab feels, it is OpenViking. It is the shared long-term memory for my AI agents.
OpenCode and Hermes are separate clients with separate sessions, but they read and write the same OpenViking memory. A decision made in one can be recalled by the other. That is what keeps them in sync instead of behaving like two strangers with different notes.
OpenViking holds context, prior decisions, incident history and retrieved documentation. It is not proof of live state. Old memory can accurately describe a system that no longer exists. Current instructions and runbooks take precedence, and important claims still need live verification.
Skills are reusable procedures, not memory. MCP servers expose tools, not memory. I keep those layers separate because otherwise it becomes hard to tell what the agent knows, what it can do, and what is actually true.
Two Agents, One Shared Memory#
OpenCode and Hermes run natively because they need access to projects and host tools. Supporting infrastructure runs separately. They have separate sessions and separate browser profiles, but they share the OpenViking memory layer.
I distinguish four parts of the setup:
- Instructions define operating boundaries and repository conventions.
- Memory gives both agents the same long-term context.
- Skills provide reusable procedures for particular tasks.
- MCP servers expose tools and structured access to other systems.
The shared MCP integrations include:
| Integration | Role |
|---|---|
| Context7 | Current developer documentation |
| shadcn | UI component and registry tooling |
| REA | Reverse-engineering tools |
| Nivra | Notes and structured content |
| Orva | Functions and automation |
| OLX | Marketplace searches and listing details |
| Kite | Broker integration |
Configuration does not imply every integration is authenticated, used daily, or unrestricted. Consequential operations still need their own approval boundaries.
Skills are where the working knowledge lives: browser automation, document sharing, homelab checks, diagrams, memory retrieval, disposable testing. Some are shared; some are agent-specific. I do not try to enumerate every skill here. The important part is the pattern: a skill is a procedure the agent can load when the task calls for it, not a permanent prompt stuffed into every conversation.
The goal is not to load every possible tool into every task. It is to make the relevant procedure discoverable when needed.
Browser Automation#
Playwright CLI handles reproducible tests and precise UI debugging. Browser Use handles interactive browsing and unfamiliar forms. For plain information retrieval, an API or HTTP fetch is often enough.
The Browser Use runtime runs Chromium in Docker, with separate persistent profiles for OpenCode and Hermes. Browser debugging ports are not published.
Whole-task delegation uses the configured remote model provider, so page context can leave the machine even though Chromium runs locally. Local embeddings through Ollama do not make every agent inference local either.
The browser container is not a hostile-code sandbox. For experiments requiring a clean machine, I use disposable microsandbox microVMs rather than modifying the host.
That separation matters when an agent wants to install dependencies, test a migration, or reproduce an unfamiliar failure.
Sharing Work Back With Me#
The agents can write a deliberately public Markdown draft into the shared workspace and give me a browser link. I can read it, edit it, and ask an agent to work from the updated version.
This article is one example.
That does introduce a trust boundary: publicly editable document text is not an instruction channel. An agent should not deploy something or run a command merely because someone added that request to a document.
Sharing a draft is a separate step from publishing it here.
Monitoring: The Host and the Services Are Different Questions#
Monitoring one node has a structural blind spot: if the host is down, every dashboard hosted on it is down too. I separate two questions instead of pretending one screen answers both.
- Is the machine healthy? Beszel and the native diagnostics.
- Can I reach the service? Homepage health checks and the application’s own endpoint.
I retired VictoriaMetrics and Grafana when the cluster went away. They were accurate, but they were another stack to operate. Beszel gives me enough history for one host, and the host itself exposes the few numbers my dashboards actually need.
What collects the data#
| Component | What it answers |
|---|---|
| Beszel hub (Docker) | Host and container history, CPU, RAM, disk, fan speed, iGPU activity, SMART for the internal disks |
| Beszel agent (native) | Reads host sensors and Docker state; keeps reporting when the Docker daemon itself is unhealthy |
homelab-stats.service (native) | Read-only JSON with CPU, RAM, temperature, disk, swap, container counts, failed units, uptime and interface throughput |
| Home Assistant REST sensors | Polls the stats endpoint every 15 seconds for the Nodes dashboard and automations |
smartd (native) | Sends disk-health warnings to Telegram through a small alert script |
| Frigate (Docker) | Camera recording, object detection and events over MQTT |
| Homepage (Docker) | Service catalogue and internal health dots; no Docker socket |
| Diagnostics (native) | crash-record, power-log and powerkey-watch collect evidence around an unexpected shutdown or power-button event |
The Beszel agent is native on purpose. A monitoring agent that disappears with the Docker daemon cannot tell me the daemon is unhealthy.
The homelab-stats endpoint is deliberately small. It is not a metrics database. It exposes the current values that Homepage and Home Assistant need, and it is read-only from the consumer’s side.
Homepage’s health checks use internal container names, not the public HTTPS hostnames. A Tinyauth redirect is correct behaviour for a browser, but it would look like a failed check if I pointed the monitor at the authenticated URL.
The dashboards I actually use#
| Dashboard | What it is for |
|---|---|
| Homepage (private dashboard) | First screen: Overview, Storage, Media, Applications and Control, with live service tiles |
Homelab → Cameras (/homelab-status/cameras) | Live outdoor video, motion/person/dog/object states, detection and recording controls, Frigate link |
Homelab → Nodes (/homelab-status/nodes) | The single host: CPU, RAM, temperature, root/data/backup disk, containers, unhealthy count, load, uptime; Beszel for history |
AC → Control (/samsung-ac/control) | Thermostat, room temperature, mode, fan, comfort, independent airflow axes and schedule |
AC → Care (/samsung-ac/care) | Self-check, filter and cleaning state, local history; maintenance actions stay confirmation-protected |
Smart Plugs → monitor (/smart-plugs/monitor) | One filtered view for the plugs: live W/V/mA/fault, estimated energy, history and protected power actions |
| Overview, Quick, Map | Everyday entities, quick actions and the location view |
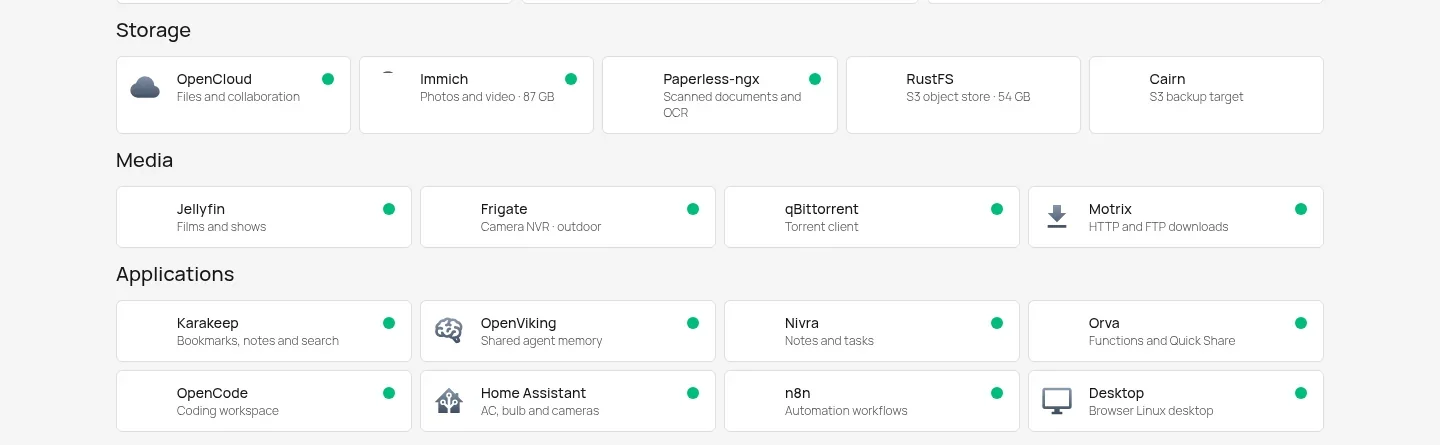
Homepage is the first screen: service groups and live health dots. The header is intentionally just the date and time.
The Smart Plugs dashboard is intentionally one dashboard with a selector, not one dashboard per plug. The selector is an input_select; the cards reference the selected plug’s entities. Another 10 A plug and a 16 A plug are planned but not paired, so they are not selectable yet.
The AC dashboard is split into Control and Care because operating the unit and maintaining it are different tasks. The self-check card shows actual state, stored result and reported error—not a made-up health score.
What this monitoring does not cover#
- The host is still the observer. A full host outage takes Beszel, Homepage, Home Assistant and this article’s preview down together. Telegram SMART alerts are an external path, but they are not a dead-man’s switch.
- Beszel is not a long-term archive. It is the right size for one host, not a replacement for a multi-month metrics store.
- SMART coverage stops at the internal disks. The external USB backup is not included in the current sensor set.
- There is no UPS. A power cut removes the host and its monitoring at the same time.
- There is no independent off-host uptime checker. That is a deliberate gap, not a claim that the gap does not exist.
Those limits matter more than adding another coloured graph.
Home Automation: Local Paths, Not Cloud Buttons#
Home Assistant runs as a Docker container. It is not Home Assistant OS, so there is no Supervisor managing add-ons for me. MQTT and Frigate run as separate services. That is more work at deployment time, but it keeps the moving parts visible.
Home Assistant is also the authenticated boundary for scripts and agents. I do not need a separate REST bridge for every device.
The devices#
- Samsung split AC — LocalThings
v0.34.0over OCF/CoAP with DTLS on UDP49154. Verified authenticated reads of/oic/d,/oic/pand/device/0, a native climate entity, and encrypted traffic directly between Home Assistant and the AC. - Wi-Fi bulb — Tuya Local
2026.9.2over Tuya 3.3, TCP6668. Verified power, brightness, colour and white-temperature read-back, and 39 frames directly between HA and the bulb; DP20 power, DP21 mode, DP22 brightness, DP23 white temperature, DP24 colour. - Smart plug, 10 A — Tuya Local over Tuya 3.5, TCP
6668. Verified live W, mA, V and fault; the profile matched the actual datapoints. Energy is estimated locally because no hardware total is reported. - Outdoor camera — RTSP → Frigate → MQTT → Home Assistant. Verified live H.264 restream, motion/person/dog events and recording controls; no cloud NVR.
The AC and the bulb have their own articles because the device details deserve more than a short entry. The short version is that both integrations speak the device’s existing LAN protocol. They do not replace the firmware or remove every vendor dependency.
How the reverse engineering actually worked#
This was protocol investigation, not breaking encryption or modifying firmware. The pattern was similar each time.
- Find the device on the LAN. DHCP lease, ARP/neighbour table, MAC address, hostname and listening ports. I kept scans bounded and avoided changing device state.
- Watch what the device already sends. For the bulb, seven target-originated UDP broadcast frames over 30 seconds advertised Tuya 3.3, encryption enabled and a product identifier. The broadcast did not contain the local key.
- Identify the protocol. Samsung exposes OCF resources over CoAP, encrypted with DTLS on UDP
49154. Tuya uses broadcast discovery plus encrypted TCP6668for control. - Use the existing implementation. LocalThings, backed by
smartthings-local, for the AC; Tuya Local for the bulb and plug. These projects already implement the protocol and crypto. Re-implementing that would add risk without adding useful understanding. - Get the key the sanctioned way. Where a local key was required, I approved one-time account access in Smart Life or SmartThings and retrieved it. Keys went into protected Home Assistant configuration and the password vault, never Git or a blog post.
- Map the actual device, not a lookalike. The bulb profile
rgbcw_lightbulbwas chosen because its product ID and datapoint types matched. The plug profilesmartplugv2_energyv2was chosen because DP44 is an empty string; the superficially similarenergyv3expects base64. A wrong profile can reverse a temperature scale or expose an energy entity that does not exist. - Verify the local path. Capture traffic during a real command, read the state back, reload the integration, restore the previous state. The bulb returned approximately
4501 Kfor a4500 Krequest. That is close enough to confirm the mapping; it is not a calibration claim. - Write down the boundary. Local control does not mean the vendor cloud is gone. The stock AC can still contact Samsung, and removing it from SmartThings can affect its Wi-Fi configuration. A LAN integration is a local path, not a firmware replacement.
For the bulb investigation I used REA 6.7.0 with Wireshark/TShark 4.4.19 and capinfos over a bounded capture. The useful evidence was not a decrypted payload; it was the traffic pattern, the advertised product identity and the direct HA-to-device connection during a command.
What “local” does and does not mean#
- Setup may use the vendor cloud once for authorization or local-key retrieval.
- Normal control uses the LAN.
- The vendor app may still work. That is a separate path, not proof that the local path is fake.
- No firmware was modified and no encryption was broken.
- Cloud-only features are not recreated from guessed values.
- The PC plug’s energy total is an estimate, not a hardware meter reading.
- The AC’s physical actuator behaviour and a full WAN-outage test remain separate acceptance boundaries.
That is the honest version of “local control”. It is more useful than a blanket claim that nothing touches the internet.
Recovery Is a Procedure, Not a Backup Folder#
A restart policy is not a backup. A backup is not a recovery plan. A running container is not evidence that its data can be restored.
I try to keep those three things separate.
What recovery actually needs#
| Service | What I need to bring it back |
|---|---|
| Immich | PostgreSQL data, the media library and its configuration; the container image alone is not enough |
| Paperless | The SQLite database, the document store and configuration |
| Home Assistant | Configuration, database and a usable backup archive, plus the integration credentials |
| Nivra / Karakeep | Their SQLite databases, assets and configuration |
| mdx | The Markdown files only; there is no history or locking, and drafts are not canonical |
| Media | The library and application configuration; replaceable, so it is not my first backup priority |
The data lives under /data/apps/<service> on the SATA disk. Docker’s own state stays on the NVMe. Deployment definitions and runbooks live in Git; secrets do not.
What I have today#
- Compose definitions, operational runbooks and architecture sources in Git.
- Application data under
/data/apps/<service>. - Home Assistant backups on a daily 03:00 schedule, with seven copies and 30-day retention. They are local backups.
- Time Machine on the MacBook writing to the
BACKUPSMB share. - Secrets in 1Password or protected runtime files, not in the repository.
- Restore evidence for some services from the migration and recovery work. Not every service has been restored end to end.
What is still missing#
- There is no complete off-site copy of every application’s data.
/BACKUPis another disk attached to the same host and the same power domain. It protects against some disk failures and accidental deletion, not against losing the machine or the room.- There is no UPS, so a power cut takes the host, its services and its monitoring down together.
- I do not have a uniform, repeatable restore test for every application.
- A directory copy is not automatically an application-consistent backup. Databases need their own procedure.
I know what a real recovery plan looks like. I am not pretending this is one for every service yet.
The operational upgrades I care about#
A UPS with graceful shutdown. An independent copy of the irreplaceable data: photos, documents, notes, Home Assistant configuration and keys. A second internal DNS resolver. Restore drills that prove the backups, not just backup jobs that report success.
Not another Kubernetes distribution.
What I’d Do Differently#
If I started again, I would define the goal before choosing the platform. “Learn Kubernetes” and “run services for myself” are both valid goals, but they lead to different labs. I spent time building the first one while measuring it against the second.
I would also treat recovery as part of the service, not a later project. A service is not finished when it starts; it is finished when I know how to bring it back.
And I would keep experiments disposable. Use a microVM or a temporary cluster for the thing I am learning. Keep the permanent lab boring.
What I’m Planning Next#
The next step is not replacing the whole node. The current host stays for now. I want to add capacity and offload specific jobs.
- Two Raspberry Pi 4B boards — offload lightweight services; one may become a dedicated Samba server. Planning.
- Larger mini PC — more headroom for services and agents, up to 64 GB RAM and 16 cores; keep a small form factor, not a desktop replacement. Planning.
- GPU node — local inference and acceleration; Mac mini rejected because Docker on macOS runs in a Linux VM; DGX Spark is ARM64, so image compatibility is a question. Evaluating.
The Pi plan is about separation, not another cluster. DNS, Samba or a small utility service can move off the main host without adding a control plane. The second internal DNS resolver could live on one of them. The mini PC plan is about headroom: 64 GB and 16 cores would let me run more services and agent workloads without turning the lab into a rack.
The GPU plan is the least settled. A Mac mini is attractive hardware, but Docker on macOS runs containers inside a Linux VM. That adds a layer and memory overhead I do not want for a container host. DGX Spark is ARM64, which is a compatibility question for x86 images. Many projects publish x86_64 first, and multi-arch support is not universal. I am still evaluating, not announcing a purchase.
None of this changes the architecture principle: keep the base simple, and add a node only when it removes a real constraint.
What the Cluster Taught Me#
I am glad I built the cluster.
It taught me about quorum, replication, scheduling, storage attachment, identity, and the difference between a successful deployment and a recoverable service. It also taught me that knowing how to build something is not the same as needing it.
The current setup is simpler because I know what the complicated version costs. I can reason about the network, DNS, TLS, storage, identity and failure modes without needing a control plane for each one. When something breaks, I can follow the path: client → DNS → Caddy → container → data.
That is the part I care about now. Not making the lab look like a small datacenter, but knowing what is running, why it is there, and what it would take to bring it back.
If you have run the three-node version, you know. The cluster is a great teacher. It is not always the right permanent home.
Simplicity is not the absence of knowledge. It is what remains after you decide which complexity earns its place.